JavaScript errors
Unfortunately, not everything in the garden is rosy. JavaScript does have a minor downside. The downside of JavaScript is that a single error may stop all of the scripts on a page from working. Yes, that means that another plugin can break LocateAndFilter’s JavaScript, and vice versa.
How to check for JavaScript errors?
If you suspect that an issue on your website is caused by a JavaScript error, there luckily is an easy way to check that. And it’s built into your browser!
Depending on your browser its naming is slightly different, but following Chrome and FireFox, we’ll call it the ‘Console’. Every browser has a different way of accessing the console, so please select your browser for detailed instructions.
How to recognize JavaScript errors?
Alright, so you’ve opened the console. Great! Now let’s see if there are any JavaScript errors.
Use the tab you opened the console with to navigate to the page you want to check, or if you’re already on that page, reload it.
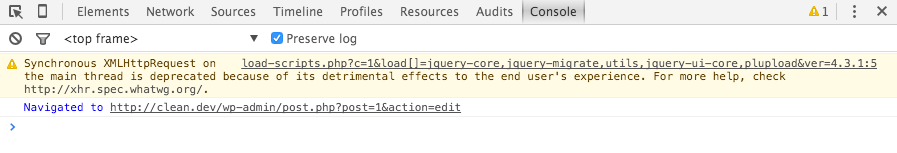
If there are no errors, you should see something like this:
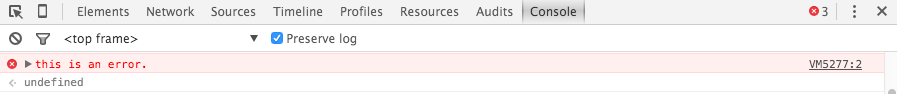
If there are errors on the page, you’ll see a red line. For example like this:
You can expand the error in the console by clicking the black arrow. It’ll then show something like this:
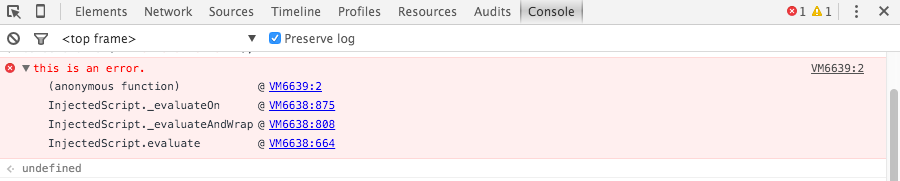
If you’ve found a JavaScript error, please take a screenshot of the expanded version of the error to include with your bug report.